How to set up an Event Integration
1. From the event integrations table, click the blue + Add Event Integration button in the top-right corner.
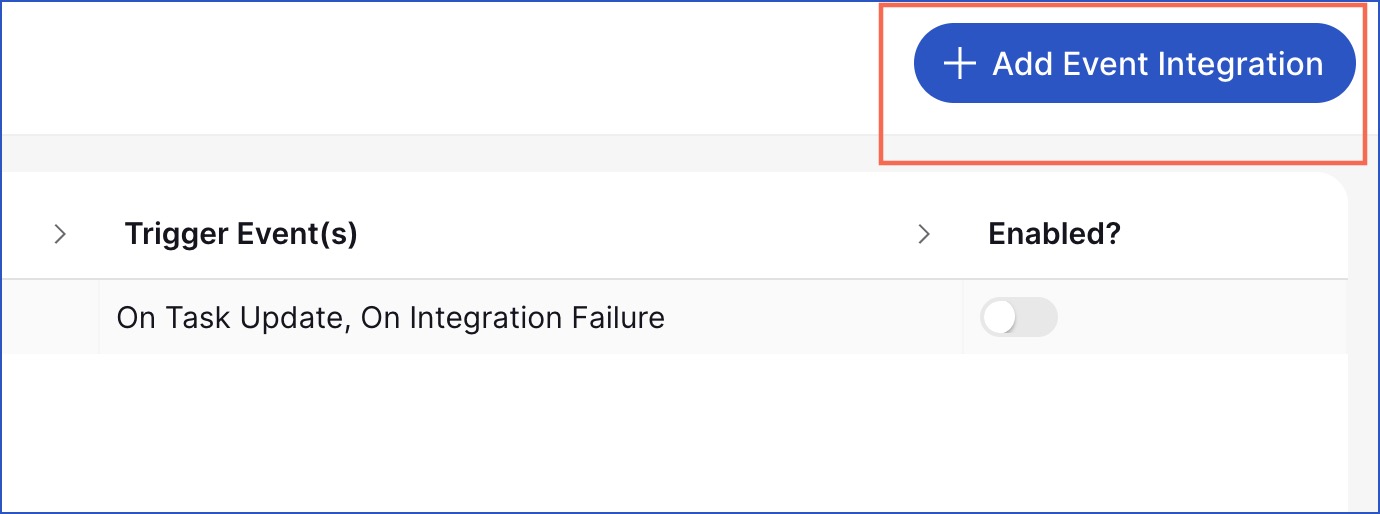
2. The New Event Integration modal displays.

Add the following information:
General settings
Name: Add a name.
Event scope: Choose the instance, workspace or runbook type where you want to monitor activity.
Event types: Select the event types you want to receive notifications for (e.g., task failures, runbook status changes).
Additional Settings
Enabled: A tick in the Enabled? box confirms that the event integration is active.
Execute in Rehearsal: Checking this option means the task can be executed when the runbook is in rehearsal mode.
Execute in Planning: Checking this option means events notifications will be sent during the planning stage. If this option is not ticked (disabled), event notifications will not be sent during the planning stage.
Note: Existing event integrations will default to sending event notifications during the planning stage to maintain current functionality. This can be changed within the Additional Settings of an event integration.
Authorization settings
Please see our Authorization settings page for further information on how to complete the fields in this section.
Request settings
Please see our Request settings page for further information on how to complete the fields in this section.
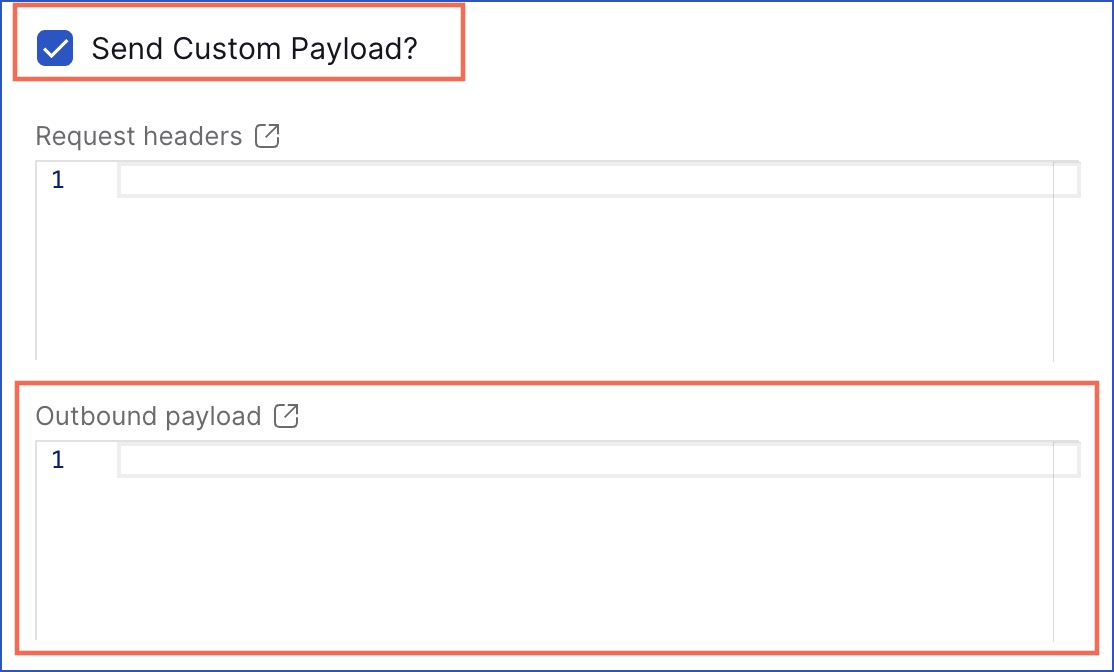
To send a custom payload of your own defined set of data, place a tick in Send Custom Payload? Option. The Outbound payload section will then display below. Here you can add the fields and values you want to send instead of the default data Cutover sends.
3. Click Cancel to close the New event integration window or Click + Create to create your event integration.
From now on, whenever a selected event occurs within the defined scope, a message (either a default or custom payload) will be sent to your specified endpoint. This can then trigger actions in your third-party tools—such as creating a ServiceNow incident or sending a message to Microsoft Teams.

Edit an Event Integration
To make changes to an existing integration:
- Click on it in the Event Integrations table.
- An edit panel will display on the right hand side.
- Edit any field from the three tabs such as the event types, event scope, authorization or request details.
Additional Settings:
There are additional settings at the bottom of this panel which are:
- Enabled - Toggle event delivery on or off.
- Execute in Rehearsal: If selected, the event integration will trigger during rehearsal runs.

Track Activity
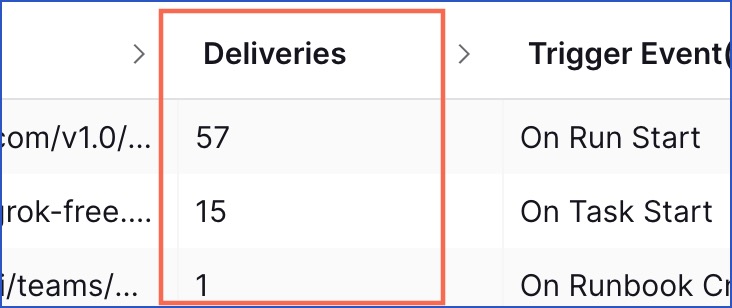
Each event integration displays a Deliveries counter, showing how many times an event payload has been sent—so you can easily monitor activity at a glance.
Enable or Disable an Event Integration
Once you've created an Event Integration, you can turn it on or off at any time—without needing to delete or recreate it. You can do this in two ways:
- From the Event Integrations table view:
- Go to Settings > Event Integrations.
- Use the toggle switch next to the integration name.
.jpg)
- From the Edit panel:
- Click on the integration name to open its details.
- On the right-hand side, scroll to the Additional Settings section.
- Check or uncheck the box labelled Enabled to update its status.
Note: Disabling an integration pauses all event delivery for that configuration, but retains the setup so you can re-enable it anytime.
Message Log
The Message Log tab can be found near the top left of the Event Integrations page. It shows a debug log of payloads emitted by your event integrations.

Use the Filter option in the top left corner to display logs for specific event integrations. Deselect a filter option to clear the filters.

You can use the following filters to narrow down the log:
Enabled — Show only events from integrations that are currently enabled, hiding any inactive ones.
Status — Filter by Failed or Succeeded to quickly identify events that didn't deliver as expected.
Subscriptions — Select a specific event integration to view only its events. Integrations are grouped by subscription for easier navigation.Use these filters in combination to quickly troubleshoot failed deliveries or verify that a specific integration is emitting payloads correctly.
The table view displays key information for each emitted event, including:
- Date and time the event was emitted
- Event integration name that emitted the event
- Trigger event (what caused the event to emit)
- Status and response code
Click on any item in the table to open the Message Details panel.
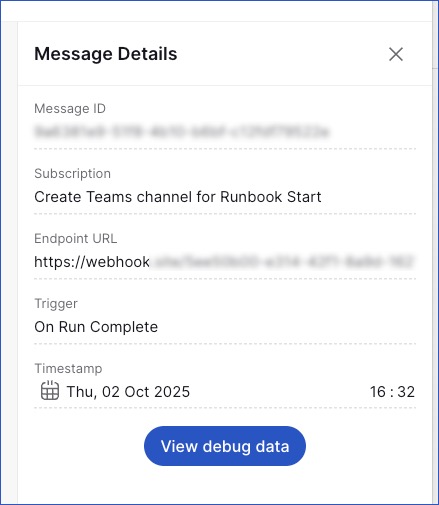
From here, select View debug data to open the Debug Integration Request and Response window.
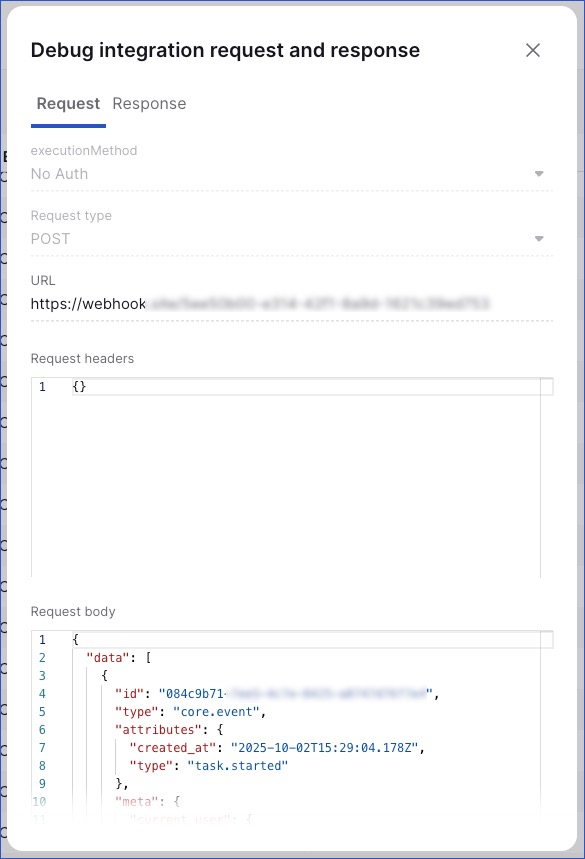
This window provides two tabs:
- Request – shows the request payload sent by the integration
- Response – shows the response received from the target system
Use this information to diagnose and understand why an event integration may have failed.